Trusting people on the Web

An interesting post appeared in my feed reader this morning. This post, published on Slashdot, is saying:

“[…] a Newsweek piece suggests that the era of user-generated content is going to change in favor of fact-checking and more rigorous standards. […] “User-generated sites like Wikipedia, for all the stuff they get right, still find themselves in frequent dust-ups over inaccuracies, while community-posting boards like Craigslist have never been able to keep out scammers and frauds. Beyond performance, a series of miniscandals has called the whole “bring your own content” ethic into question. Last summer researchers in Palo Alto, Calif., uncovered secret elitism at Wikipedia when they found that 1 percent of the reference site’s users make more than 50 percent of its edits. Perhaps more notoriously, four years ago a computer glitch revealed that Amazon.com’s customer-written book reviews are often written by the book’s author or a shill for the publisher. ‘The wisdom of the crowds has peaked,’ says Calacanis. ‘Web 3.0 is taking what we’ve built in Web 2.0–the wisdom of the crowds–and putting an editorial layer on it of truly talented, compensated people to make the product more trusted and refined.’”

What is probably the best way to sell something to someone? When someone of trust recommends buying something for X, Y and Z reasons, to someone else. It is possibly why blogs are so powerful to sell things. You have people that write about their lives and their passions. From time to time they write about things they bought and they really liked. They are not paid for it; they just share their experience with other people. What if someone you learned to trust over time, by reading its blog, tell you that one of the thing you wanted to buy, but that you were was not sure to buy for some reasons, tell you that it is an awesome thing to have? Probably that you will more than likely be willing to buy the thing right away, online or in a local store. This is only possible because of the trust you have in this blogger, a trust that you learned over time, while reading its blog.

At least, it is what happens with me, and I hope I am not alone.

The problem they outline in this article is that the trust link has been broken between web readers and content creator. In systems such as Amazon.com and Ebay.com your user identity lives by its own, only within these systems. So you, as a reader and consumer on these web sites, only have access to things these content creator said, on these specific web sites only. You don’t have access the other things they written about, elsewhere on the Web. This means that you only have this partial and incomplete information to trust a person that said something about something you are reading, or that you are about to buy. This is more a question of faith than a question of “trusting the crowd”.

Calacanis said ‘Web 3.0 is taking what we’ve built in Web 2.0–the wisdom of the crowds–and putting an editorial layer on it of truly talented, compensated people to make the product more trusted and refined’. First of all, please stop using the Web 3.0 term for anything; just stop using it at all… Otherwise, I don’t think the benefits would be enough to justify the costs of such a system powered by a crowd of “expert”. In that case, is the whole thing doomed?

The main force in action here is trust. The idea is to strengthen the trust level between people across all web sites. What if, from a comment published by a user on Amazon.com, I could end up knowing the URL of its blog, if I could see the ratings he got from Ebay.com users, if I could read other comments he wrote on other web sites and blogs? What if I could know more about a person from any location on the Web, by referring to a comment he wrote?

Then I could start building a better trust relationship with that person, and put more weight in what he said.

Welcome on the Semantic Web.

Data Referencing, Data Mobility and the Semantic Web

I recently started to follow discussions evolving around the Data Portability project. It is an emerging community of people that tries to define the principles and push technologies to encourage the “portability” of data between people and systems. Other such initiative exists, such the Linking Open Data Community (that emerged from the semantic web community more than one year ago), The Open Knowledge Definition, and there are probably many others too. However DP is the one that recently got the biggest media coverage considering “support” and covering from some people and groups.

An interesting thread emerged from the mailing list that was trying to get a better definition of what “Data Portability” means.

Henry Story opened the door of the “linked data” (instead of moving data) and Kingsley nailed the two important distinction points:

  1. Data Referencing
  2. Data Mobility (moving data from distinct locations via Import and Export using agreed data formats)

What the Semantic Web means in this context?

What these two critical points mean in terms of semantic web concepts and technologies?

Defining the context

This discussion will be articulated in one context: the Web. The current discussion will take into consideration that all data is available on the Web. This means the use of Web technologies, protocols, standards and concepts. This could be extended to other networks, with other protocols and technologies, but we will focus the discussion on the Web.

Data Referencing

How data referencing is handled on the semantic web? Well, much information is available about that question on the Linked Data Wikipedia page. Basically it is about referencing data (resources) using URIs (unique resources identifiers), and these URIs should ideally be “dereferencable” on the Web. What “dereferencable on the Web” means? It means that if I have a user account on a certain web service, and that I have one URI that define that account, and that this URI is in fact a URL, so that I can get data (normally a RDF document; in this example it would be a RDF document describing that user account) by looking at this URL on the Web (in this case we say that the URI is dereferencable on the Web).

This means one wonderful thing: if I get a reference (URI) to something, this means that in the best of the cases, I can also get data describing this thing by looking on the Web for its description. So, instead of getting a HTML page describing that thing (this can be the case, but is not limited to) I can get the RDF description of that thing too (via web server content negotiation). This RDF description can be use by any web service, any
software agent, or whatever, to helps me to perform specific tasks using this data (Importing/Exporting my personal data? Merging two agendas in the same calendar? Planning my next trips? And so on).

Now that I have a way to easily reference and access any data on the Web, how that accessible data can become “mobile”?

RDF and Ontologies to makes data “mobile”

RDF is a way to describe things called “resources”. These resources can be anything: people, books, places, events, etc. There exists a mechanism that let anybody describing things according to their properties (predicates). The result of this mechanism is a graph of relationships describing a thing (a resource). This mechanism do not only describes properties of a Thing, but also describe relationship between different things. For example, a person (a resource) can be described by its physical properties, but it can also be described with its relation with other people (other resources). Think about a social graph.

What is this mechanism? RDF.

Ontologies as vocabularies standards

However, RDF can’t be used alone. In order to make this thing effective, one need to use “vocabularies”, called ontologies, to describe a resource and its properties. These ontologies can be seen as a controlled vocabulary defined by a community of experts to describe some domains of things (books, music, people, networks, calendar, etc). It is much more than a controlled vocabulary, but it is easier to understand what it is that way.

FOAF is one of these vocabularies. You can use this ontology to describe a person, and its relation with other people, in RDF. So, you will say: this resource is named Fred; Fred lives near Quebec City; and Fred knows Kingsley. And so on.

By using RDF + Ontologies, the data is easily made Mobile. By using such standards that communities, people and enterprises agree to uses; systems will be able to read, understand and manage data coming from multiple different data sources.

Ontologies are standards ensuring that all the people and systems that understand these ontologies can understand the data that is described, and then accessible. It is where data becomes movable (mobility is not only about accessibility for download, it is also about understanding the transmitted data).
Data description robustness

But you know what is the beauty with RDF? It is that if one of the system doesn’t know one ontology, or do not understand all classes and properties of an ontology used to describe a resource, it will only ignore that data and concentrate its effort to understand the thing being described with the ontologies it knows. It is like if I would speak to you, in the same conversation, in French, English, Italian and Chinese. You would only understand what I say in the languages you know, and you will act considering the things you understood of the conversation. You will only discard the things you don’t understand.

Conclusion

Well, it is hard to put all these things in one single blog post, but I would encourage people that are not familiar with these concepts, terminologies and technologies, and that are interested in the question, to start reading what the semantic web community wrote about these things, what are the standards supported and developed by the W3C, etc. There are so many things that can change the way people use the Web today. It is just a question of time in fact!

Second version of Yago: more facts and entities

In the past month or two I got more and more interested in the Yago project. First this gave me the opportunity to find a really interesting person, the main author of Yago, Fabian Suchanek. I have been impressed by the simplicity (and creating simple things with such complex stuff is certainly the harder task out there) and the coverage of Yago. It was well built and based on solid foundations. It is after downloading it, converting it into RDF, indexing it into a triple store and fixing serialization glitches and semantic relations issues that I really started to appreciate all the work that has been put in that project.

I am now pleased to write about the next version of Yago that has recently been released by Fabian & Co. The papers describing this new version has been published about a week ago (and written by Fabian, Gjergji Kasneci and Gerhard Weikum), and the new data set has been released a couple of days ago. After fixing one last RDF issue with the conversion of the Yago data set into RDF, I am now ready to write something about it.

First of all, what is Yago? Yago is some kind of ontologies. It is a dataset composed of entities and facts about these entities. It describes things such as Abraham Lincoln (entity) is the successor (fact) of James Buchanan (entity). All these entities and facts come from two data sources: Wikipedia and Wordnet. Please read Fabian’s paper to know exactly hat come from where.

Yago has its own representation and logic framework. However, converters exist to convert the Yago dataset into RDF serialized in XML or into other formats. Just to demonstrate how Yago is complete by itself, a query language has been created explicitly to query Yago. However, one can convert the Yago dataset into RDF, index it in a triple store, and query the same information using SPARQL (it is what I have done myself). To read about these frameworks, and to read about how Yago is working internally, you have to read the presentation paper written by Fabian.

So, what is new with this second version of Yago?

There is about 500 000 additional entities (now counting about 1 500 000 entities in the Yago dataset).

Also, many new predicates have been added in this new version, there is the list of 99 predicates available to build queries:

actedIn, bornIn, bornOnDate, created, createdOnDate, dealsWith, describes, diedIn, diedOnDate, directed, discovered, discoveredOnDate, domain, during, during, establishedOnDate, exports, familyNameOf, foundIn, givenNameOf, graduatedFrom, happenedIn, hasAcademicAdvisor, hasArea, hasBudget, hasCallingCode, hasCapital, hasChild, hasCurrency, hasDuration, hasEconomicGrowth, hasExpenses, hasExport, hasGDPPPP, hasGini, hasHDI, hasHeight, hasImdb, hasImport, hasInflation, hasISBN, hasLabor, hasMotto, hasNominalGDP, hasOfficialLanguage, hasPages, hasPopulation, hasPopulationDensity, hasPoverty, hasPredecessor, hasProduct, hasProductionLanguage, hasRevenue, hasSuccessor, hasTLD, hasUnemployment, hasUTCOffset, hasValue, hasWaterPart, hasWebsite, hasWeight, hasWonPrize, imports, influences, inLanguage, interestedIn, inTimeZone, inUnit, isAffiliatedTo, isCalled, isCitizenOf, isLeaderOf, isMarriedTo, isMemberOf, isNativeNameOf, isNumber, isOfGenre, isPartOf, isSubstanceOf, livesIn, locatedIn, madeCoverFor, means, musicalRole, originatesFrom, participatedIn, politicianOf, produced, publishedOnDate, range, since, subClassOf, subPropertyOf, type, until, using, worksAt, writtenInYear, wrote

Also the converted RDF dump is much, much bigger than the previous one. In fact, the RDF dump that is generated is about 15 gigabytes.

Trying to slim the RDF dump using N3 serialization

It is after noticing the size of the RDF dump serialized in XML that I checked if we could slim this data dump a bit by serializing all the RDF using N3/Turtle instead of XML.

However it was not concluding. Except for the friendliness aspect of the N3 code compared to the XML one, there is no real gain in term of space. The reason is that Yago extensively use reification to assert a statement about a triple (a fact). Since there is no reification syntax in N3 (or N3 Turtle), we have to describe the reification statement at length like this:

A RDF/XML Yago fact:

<?xml version=”1.0″?>
<!DOCTYPE rdf:RDF [<!ENTITY d “http://www.w3.org/2001/XMLSchema#”>
<!ENTITY y “http://www.mpii.de/yago#”>]>

<rdf:RDF xmlns:rdf=”http://www.w3.org/1999/02/22-rdf-syntax-ns#”
xmlns:base=”http://www.mpii.de/yago”
xmlns:y=”http://www.mpii.de/yago/”>
<rdf:Description rdf:about=”&y;Abraham_Lincoln”><y:hasSuccessor rdf:ID=”f200876173″ rdf:resource=”&y;Thomas_L._Harris”/></rdf:Description>
<rdf:Description rdf:about=”#f200876173″><y:confidence rdf:datatype=”&d;double”>0.9486150988008782</y:confidence></rdf:Description>
</rdf:RDF>

And its RDF/N3 counterpart:

@base <http://www.mpii.de/yago> .
@prefix y: <http://www.mpii.de/yago/> .
@prefix rdf: <http://www.w3.org/1999/02/22-rdf-syntax-ns#> .
@prefix xsd: <http://www.w3.org/2001/XMLSchema#> .
<#Abraham_Lincoln> y:politicianOf <#United_States> .
<#f201920397> rdf:type rdf:Statement ;
rdf:subject <#Abraham_Lincoln> ;
rdf:predicate y:politicianOf ;
rdf:object <#United_States> ;
y:confidence “0.967356428105286”^^xsd:decimal.

Since Yago is a special case that uses extensively reification for all of its facts, you can’t gain significant hard drive space by serializing in N3: it is at best marginal.

Some queries

What would be the usefulness of Yago without being able to query it? There won’t be any; so lets test it with some SPARQL queries.

Question 1: How is called the place where Andre Agassi is living?


SPARQL query:

sparql
select *
from <http://www.mpii.de/yago/>
where
{
<http://www.mpii.de/yago#Andre_Agassi> <http://www.mpii.de/yago/livesIn> ?place.
?place <http://www.mpii.de/yago/isCalled> ?place_name.
}

Result: “Las Vegas”

Question 2: What are the other film produced by the guy that produced the movie Blade Runner?

SPARQL query:

sparql
select *
from <http://www.mpii.de/yago/>
where
{
?producer <http://www.mpii.de/yago/produced> <http://www.mpii.de/yago#Blade_Runner>.
?producer <http://www.mpii.de/yago/produced> ?other_movies.
}

Result: “The Italian Job”, “Murphy’s War”, “Robbery”

And so on. It is that simple. If you do not know the URI of an entity, you only have to refer to its label using the property isCalled.

Considering that fact that we know the properties that are describing within Yago, and considering that all properties are consistent within Yago, it become quite easy to get interesting stuff by querying the dataset.

Conclusion

This new version is a clear leap ahead. It continues to be as simple as the first version. It is enhanced with more entities and more predicates; but is always consistent with a really good accuracy level.

I would like to see one more thing with Yago: being able to dereference these URIs on the Web. I will check with Fabian to make all these URIs dereferencable on the Web. So expect another blog post announcing this in the following days or weeks.

Why reading DataViewer pages instead of conventional web pages?

Yesterday Georgi Kobilarov asked this question reading this blog post about the DataViewer:

“could you elaborate on an example in which the Zitgist Browser / DataViewer enables me (the end-user) to do something I couldn’t do by reading web documents or even do something faster than by reading web documents?”

This is a good and legitimate question. However the first question would be: what Semantic Web documents (RDF documents) are used for? The idea was probably to gives the Web back to machines, so that they can have access and process the data more easily.

In such a vision, the use of such a DataViewer can raise some questions, as you did.

So, what is the usefulness of such a tool to end-users?

If you tell me that your home page contains the same information as the RDF document describing entities (and all the information about them) available from your home page, then yes, a human should read your home page more easily (since HTML documents are built for humans).

But one characteristic of RDF, and we can see it with the emergence of the Linking Open Data Community, is that data (entities) can be linked together, as webpage are.

Entities, so the data describing these entities, are meshed together. This means that my personal profile can be linked to the semantic web document describing the city where I live; it can also be linked to the articles I wrote; be linked to my friends and co-workers; be linked to the company I currently work for; to the projects I worked on and the ones I am currently working on; and so on.

All this information is accessible from one place: my personal profile semantic web document. All the other information is meshed and displayed in the DataViewer. So, instead of browsing all these web pages, you will have all the information displayed in a DataViewer page.

Given this vision of things, I envision that in the future people will craft data: describing things and linking things together, instead of crafting web pages. The data itself will drive the generation (and optimization) of user interfaces that will display that data.

The idea of the current DataViewer is simple: shapeshifting the user interface to maximize the display of meshed data. The same principles can apply to other systems such as emails clients, rss readers, web widgets, etc. What the DataViewer is, is a kind of semantic web data management system. What it produces, for the moment, is an HTML document. But I can assure you that you will see it incarnated in other services and in
other environments.

The DataViewer is not the answer to all problems of the World; however it tries to do one thing: managing the presentation of semantic web data to end-users. At the moment it takes the incarnation of a web page, but it the future it will be extended to other things. What is important is the principles, concepts and vision supporting the development of such presentation and management tools.

But we shouldn’t fool ourselves here: web page (HTML pages) have always been created, developed, crafter for humans. They are optimized for human understanding. An interface such as the DataViewer can’t compete with a will crafted web page. However it can do some things that web page can’t do if it has access to well crafted data sources. It can present, in a meaningful way, information that comes from a myriad of data sources, all in the same page, ready to gives immediately the information the user is looking for.

Zitgist DataViewer

Zitgist is releasing a totally new semantic Web data viewer: the Zitgist DataViewer (on test servers). This new Web service pushes even further the semantic Web data visualization principles initiated with the Zitgist Browser.

The goal of the Zitgist DataViewer visualization tool is to provide a user interface that morphs semantic Web data into a form that can be easily read and understood by humans. The Zitgist DataViewer moves this vision forward in three ways by:

  1. Adding features to help users manage the overload of information published from some data sources,
  2. Speeding up the data visualization process and giving more feedback to users when data sources are being analyzed and documents constructed, and
  3. Changing the templating system to make them cope with a wider range of type entities even if these types are unknown by the system.

In this blog post I will show you all the new features of the Zitgist DataViewer, how it can be used, and how each feature enhances the experience of users.

Main Entity Display Sections

On the semantic Web, everything is a “resource”. A resource can be seen as an Entity, or sometimes also called a Thing. This thing can be a person, an album, a place in the World, etc. Each entity is described by its properties: the age of a person, the name of an album, the population of a city, etc.

The Zitgist DataViewer reads all the information available for these entities, and displays it to the user as best as it can so that users can easily read and understand information about these various entities.

The first step performed by the Zitgist DataViewer is to get information about that entity and to create the Web page that will be presented to users. Figure 1 is the progress bar showing the status of the Web page creation process to the user.

page_load_progress_bar2.png

Figure 1

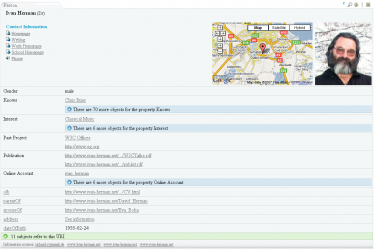
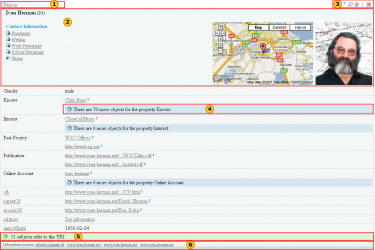
As you can see in Figure 2, each entity is represented in a table. Within each table, information available about entities is displayed to users. Figure 2 represents information available about a person called Ivan Herman.
 

general_resource.png

Figure 2
These are the six main section of a table representing an entity:

  1. Tab. This tab displays the type of the entity. In this case, Ivan is a Person. If the table is collapsed (see section about tools), the name of the entity will be displayed in the tab instead of the type.
  2. General information. This section displays general information about an entity. In this example, since the entity is a person, the name of that person, his contact information, his location and a photo of the person are displayed in the “general information section”.
  3. Tools. These tools are used to perform action on an entity table.
  4. See-more. This section aggregates all the same properties describing a person. By clicking on the “see-more” button, the complete list of properties will be displayed to the user. This feature gives an additional means for users to manage information overload.
  5. References. This section lists all other entities referring to the viewed entity. For example, in this case the references are each entity that “knows” Ivan, such as friends, co-workers, etc.
  6. Information sources. This section displays clickable links to the locations of all Web sites that contributed the actual information displayed in the DataViewer.

Note – depending on the specific type of Entity at hand – there are multiple display formats or “templates” (see below) that structure the content and format of the actual data presentation within the DataViewer.

The General Information Section

contact_information_section.png

Figure 3

This section displays all general information about an entity. General information is typically the information a human would think best describes a particular type of entity. For example, typical information about a person would be name, contact information, location, birthdate, occupation, photo, etc.

Tools

resources_tools.png

Figure 4

These tools shown in the red box are used to perform some actions on the entity table. From the left, the icons do the following:

  • mini-Z icon. This displays information available from zLinks about the entity.
  • Lookup icon. This shifts the focus of the DataViewer to this particular entity. In some cases you may have more than one entity per URI, or you may want to focus your navigation on an embedded entity, and this tool allows you to only see the currently active entity.
  • Up arrow icon. This scrolls the DataViewer up to the page from any entity table.
  • Close icon. This collapses any entity table. By clicking on this icon, only the tab becomes apparent.

See-more

This feature is used to aggregate and hide all same properties. As shown in Figure 5, if the user clicks on the blue button that says that there are 70 more “Knows” properties, then all known properties will be displayed to the user.

seemore.png

Figure 5


On the other hand, if the user check clicks on the “Hide objects” button, this expanded display is then collapsed with the section hidden again.


Inline Embedding

With the Zitgist Dataviewer, users have the possibility to embed entities on-the-spot. This means that they don’t have to open a link in another page; they can do it by embedding it in the current page.

If the user moves his mouse over a link within an entity table, he will see a blue right-arrow appearing. If the user clicks on the normal link (using the example of Uldis Bojars in Figure 6), then the entity Uldis Bojars will be opened in a new page.

On the other hand, if the user clicks on the blue right-array, the Uldis Bojars entity will be embedded on-the-spot.

inline_embed_1.png

Figure 6

If the user click on the arrow, a progress bar will shows the processing, by the server, of the creation of the Uldis Bojars entity.


inline_embed_2.png

Figure 7


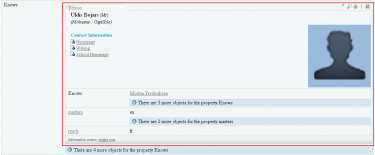
This action results in the entity Uldis Bojars being embedded in the current DataViewer page as shown in Figure 8.


inline_embed_3.png

Figure 8


References

On the semantic Web, entities are more often then not referring to other entities. Such a situation arises when I describe the fact that I know another person. So, an entity (me) knows another entity (say, Bob).

The references section of the Zitgist DataViewer thus shows the user what other entities refer to the current one being displayed.

In the Figure 9 we expand the references of the Ivan Herman entity. We now see the entities, known by the Zitgist DataViewer, that refer to the Ivan Herman entity. One reference we see is to Yves Raimond:


references.png

Figure9


Information Sources

On the semantic Web, everybody can describe anything about everything. This means that I can describe things about a person entity, or an album entity, or about virtually anything.

The only thing I have to do is to publish that information on the Web so that people can access it and do whatever they want with the information once published.

The information sources section of the Zitgist DataViewer is used to tell users where the information they are looking at comes from on the Web. So this section displays a link to all the Web pages where we got information about an entity that we display in the DataViewer.

This way, users can check the provenance (so accuracy and trust) of the information they are viewing.

information_sources.png

Figure 10


Paging Tool

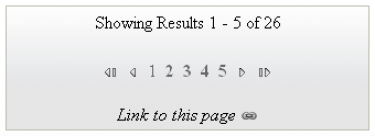
In some cases, there may be more than one resource to display to the user for a given data source. If there are more than five resources to display, results are paged. This is another feature to help the user to manage the overflow of information.
paging.png

Figure 11


Since the pages are created asynchronously (using AJAX techniques), people also copy the link from their Web browser to send to others. To do so, the user simply clicks on the “link to this page” icon and then copies the URL.


Sidebar Tools

Another feature to manage information overload is the addition of sidebar tools:


open_nav_sel_panels.png

Figure 12


The user can click on the first tab to display the “Navigator Sidebar Tool” or on the second tab to display the “Selector Sidebar Tool”. Then he can re-click on these tabs to close and hide the sidebar.


Navigator Sidebar Tool

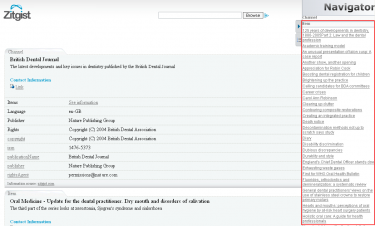
This tool (Figure 13) provides an overview of the entities available for a given data source. All entities are aggregated in the same section of the tool depending on their type (all persons together, all documents together, etc.). By clicking on one of these items the user is redirected to the table displaying information about the entity.
navigator.png

Figure 13


Selector Sidebar Tool

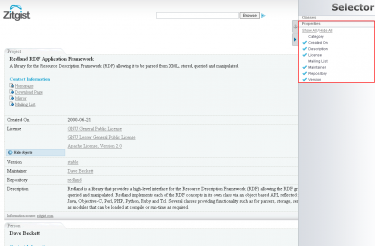
The Selector Sidebar Tool (Figure 14) is used to show and hide entities and properties to the user. By using this tool a user can hide things he doesn’t want to see:
selector.png

Figure 14


This tool can be really useful with some scenarios. For example, if a user only wants specific information from a given data source; then he only has to click on the “Hide all” button to hide all properties and then to click on the property he wants to see. This way, only the desired information will be displayed. In essence, the Selector works as a filtering or faceting mechanism.


The Templating System

The Zitgist DataViewer uses a templating system to organize the data available for a given entity. Depending on the type of an entity (is it a person? a music album? a document? a geographical place? etc.) the viewer will manage and organize the information available for an entity differently.

Each template tries to organize the information such that it is optimized for human reading and understanding.

By example, each template defines which information to put in the General Information section of each entity. It determines how to format and organize that information, how to handle specific things such as images, how to insert certain widgets such as maps and grids, and how to optimize the presentation of other kinds of information.

The only goal of the templates is to make information for each viewed entity more readable, so understandable, by humans.

The DataViewer’s new templating system also manages some properties even if a template is not defined, resulting in a hierarchy of templates composed of sub-templates inherited from upper templates.

This means that even if the Zitgist DataViewer doesn’t know how to organize information of a certain type of entity (because the viewer may not have a template for that type), it can organize other parts of the information based on existing templates and the behaviors of certain special properties.

Currently Supported Templates

There is the list of templates currently supported by the Zitgist DataViewer:

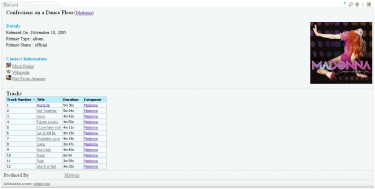
  • Music Ontology templates:
    • mo:Release
    • mo:SoloMusicArtist
    • mo:Track
    • mo:MusicManifestation
    • mo:MusicArtist
    • mo:MusicGroup

Screenshots:

moalbum.png

motrack.png

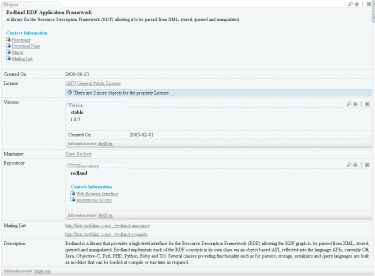
  • Description Of A Project Ontology templates:
    • doap:Project
    • doap:Repository
    • doap:Version

Screenshot:

doap.png

  • Friend Of A Friend Ontology templates:
    • foaf:Agent
    • foaf:Document
    • foaf:Group
    • foaf:Image
    • foaf:OnlineAccount
    • foaf:Person

Screenshot:

foaf.png

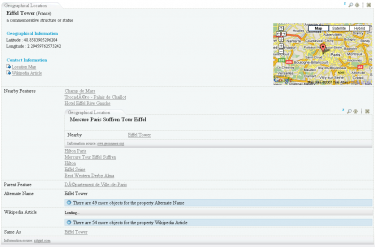
  • Geonames Ontology templates:
    • geonames:Feature

Screenshot:

geonames.png

  • Semantically-Interlinked Online Communities Ontology templates:
    • sioc:User
    • sioc:Container
    • sioc:Forum
    • sioc:Item
    • sioc:Post
    • sioc:Site
    • sioc:Space
    • sioc:Usergroup

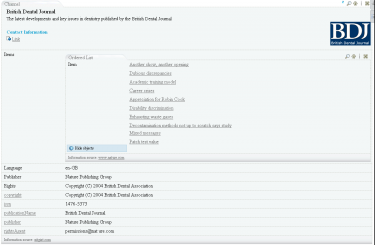
Other Ontologies also result in the addition of still more templates, for example: wgs84:Point, wps84:SpatialThing, bibo:Document, rss:Channel, rss:Image, rss:Item, frbr:Endeavour, frbr:Manifestation, rdf:Bag, rdf:Seq, owl:Thing.

One more screenshot (RSS):
rss.png

The Skinning System

While the templates organize the structure and scope of information about entities, skins manage the appearance of that organized information. The Skinning System for the DataViewer governs which colors to use, which images to use, which dimensions to use, where to place on the screen, and what to show.

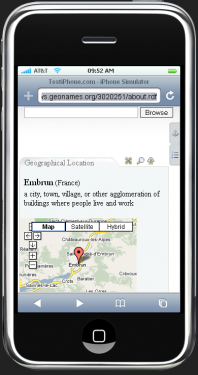
There are currently two skins created for the Zitgist DataViewer. The default skin is the standard appearance of the DataViewer within your Web browser. The second skin – called the mini-Dataviewer – is used to optimize the display of the DataViewer within a restricted area, such as a small container on a Web page or a mobile device such as the iPhone.

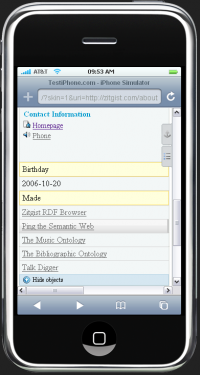
Figures 15 and 16 show two entities viewed with this mini-DataViewer interface on an iPhone. As you can see, the information is not displayed the same way, and the user interface and colors have changed to optimize for a small mobile device.
minidv_1.png

Figure 15


minidv_2.png

Figure 6


zLinks within the DataViewer

From earlier posts, recall:

“The zLinks client-side service is an entry point to a vast new world of additional rich data and link-related services […] zLinks automatically ‘turbocharges’ all of your existing and new content links to tap these resources that are contextual, relevant, informative and actionable.”

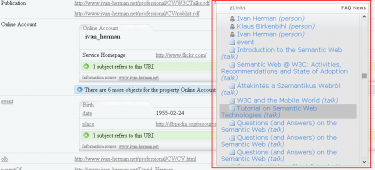
The zLinks Web service has now been integrated within the Zitgist DataViewer.

Users now have access to related stuff about every linked entity displayed in the DataViewer. These zLinks provide not only related information about an entity, but also what that entity is about and what also refers to it.

In the Figure 17 we use the zLinks Web service to take a look at the publications (in this example, the talks) linked from the entity Ivan Herman. The service lists all talks by Ivan, as well as provides links to his personal profiles and to the profiles of his friends.
zlinks_within_dataviewer.png

Figure 17


Dataviewing examples

There are a couple of visualization of URIs using the Zitgist DataViewer.

The default DataViewer user interface:

The mini-DataViewer user interface (you will be redirected to an iPhone testing website):

Conclusion

The Zitgist DataViewer is the next step to make semantic Web data more accessible and usable. It is an important upgrade over its earlier version, what had been known as the Zitgist Browser.

We are now learning how to move beyond the “triple” and how to better visualize semantic Web (RDF) information published on the Web. Many new features in the DataViewer help users to manage information overload. Others provide feedback or access to still further useful information. Performance and display speeds have been improved. Organization and a templating system add further flexibility.

We believe the usability of the DataViewer has been greatly enhanced. Still, we are not satisfied. We welcome your feedback and will continue to seek improvements for the next round of enhancements. Zitgist is committed to data usability and ease of access. We welcome your participation as we continue on this quest!