Zitgist is releasing a totally new semantic Web data viewer: the Zitgist DataViewer (on test servers). This new Web service pushes even further the semantic Web data visualization principles initiated with the Zitgist Browser.
The goal of the Zitgist DataViewer visualization tool is to provide a user interface that morphs semantic Web data into a form that can be easily read and understood by humans. The Zitgist DataViewer moves this vision forward in three ways by:
- Adding features to help users manage the overload of information published from some data sources,
- Speeding up the data visualization process and giving more feedback to users when data sources are being analyzed and documents constructed, and
- Changing the templating system to make them cope with a wider range of type entities even if these types are unknown by the system.
In this blog post I will show you all the new features of the Zitgist DataViewer, how it can be used, and how each feature enhances the experience of users.
Main Entity Display Sections
On the semantic Web, everything is a “resource”. A resource can be seen as an Entity, or sometimes also called a Thing. This thing can be a person, an album, a place in the World, etc. Each entity is described by its properties: the age of a person, the name of an album, the population of a city, etc.
The Zitgist DataViewer reads all the information available for these entities, and displays it to the user as best as it can so that users can easily read and understand information about these various entities.
The first step performed by the Zitgist DataViewer is to get information about that entity and to create the Web page that will be presented to users. Figure 1 is the progress bar showing the status of the Web page creation process to the user.

Figure 1
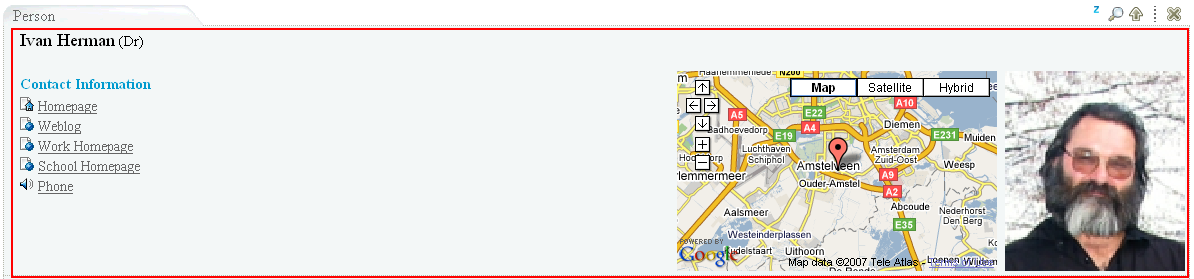
As you can see in
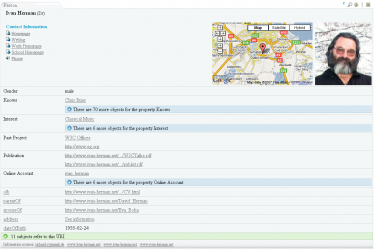
Figure 2, each entity is represented in a table. Within each table, information available about entities is displayed to users.
Figure 2 represents information available about a person called
Ivan Herman.
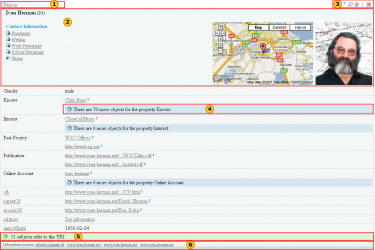
Figure 2These are the six main section of a table representing an entity:
- Tab. This tab displays the type of the entity. In this case, Ivan is a Person. If the table is collapsed (see section about tools), the name of the entity will be displayed in the tab instead of the type.
- General information. This section displays general information about an entity. In this example, since the entity is a person, the name of that person, his contact information, his location and a photo of the person are displayed in the “general information section”.
- Tools. These tools are used to perform action on an entity table.
- See-more. This section aggregates all the same properties describing a person. By clicking on the “see-more” button, the complete list of properties will be displayed to the user. This feature gives an additional means for users to manage information overload.
- References. This section lists all other entities referring to the viewed entity. For example, in this case the references are each entity that “knows” Ivan, such as friends, co-workers, etc.
- Information sources. This section displays clickable links to the locations of all Web sites that contributed the actual information displayed in the DataViewer.
Note – depending on the specific type of Entity at hand – there are multiple display formats or “templates” (see below) that structure the content and format of the actual data presentation within the DataViewer.
The General Information Section
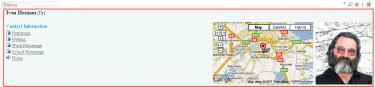
Figure 3
This section displays all general information about an entity. General information is typically the information a human would think best describes a particular type of entity. For example, typical information about a person would be name, contact information, location, birthdate, occupation, photo, etc.
Tools

Figure 4
These tools shown in the red box are used to perform some actions on the entity table. From the left, the icons do the following:
- mini-Z icon. This displays information available from zLinks about the entity.
- Lookup icon. This shifts the focus of the DataViewer to this particular entity. In some cases you may have more than one entity per URI, or you may want to focus your navigation on an embedded entity, and this tool allows you to only see the currently active entity.
- Up arrow icon. This scrolls the DataViewer up to the page from any entity table.
- Close icon. This collapses any entity table. By clicking on this icon, only the tab becomes apparent.
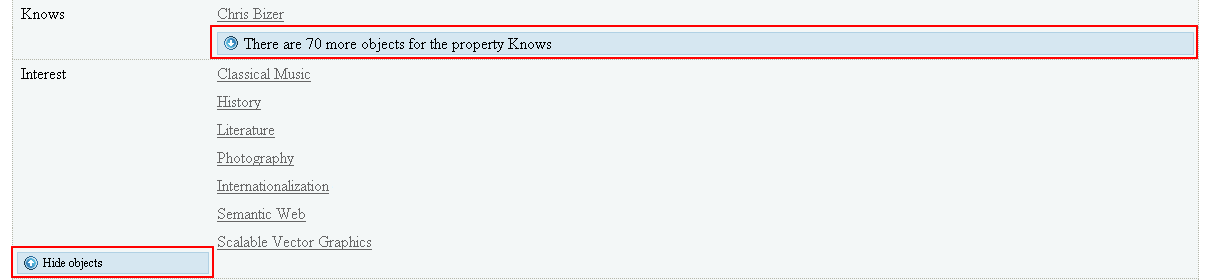
See-more
This feature is used to aggregate and hide all same properties. As shown in Figure 5, if the user clicks on the blue button that says that there are 70 more “Knows” properties, then all known properties will be displayed to the user.
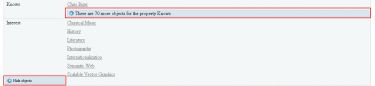
Figure 5
On the other hand, if the user check clicks on the “Hide objects” button, this expanded display is then collapsed with the section hidden again.
Inline Embedding
With the Zitgist Dataviewer, users have the possibility to embed entities on-the-spot. This means that they don’t have to open a link in another page; they can do it by embedding it in the current page.
If the user moves his mouse over a link within an entity table, he will see a blue right-arrow appearing. If the user clicks on the normal link (using the example of Uldis Bojars in Figure 6), then the entity Uldis Bojars will be opened in a new page.
On the other hand, if the user clicks on the blue right-array, the Uldis Bojars entity will be embedded on-the-spot.

Figure 6
If the user click on the arrow, a progress bar will shows the processing, by the server, of the creation of the Uldis Bojars entity.

Figure 7
This action results in the entity Uldis Bojars being embedded in the current DataViewer page as shown in Figure 8.
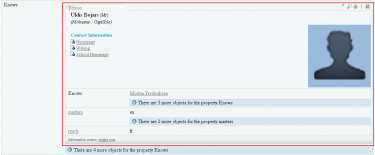
Figure 8
References
On the semantic Web, entities are more often then not referring to other entities. Such a situation arises when I describe the fact that I know another person. So, an entity (me) knows another entity (say, Bob).
The references section of the Zitgist DataViewer thus shows the user what other entities refer to the current one being displayed.
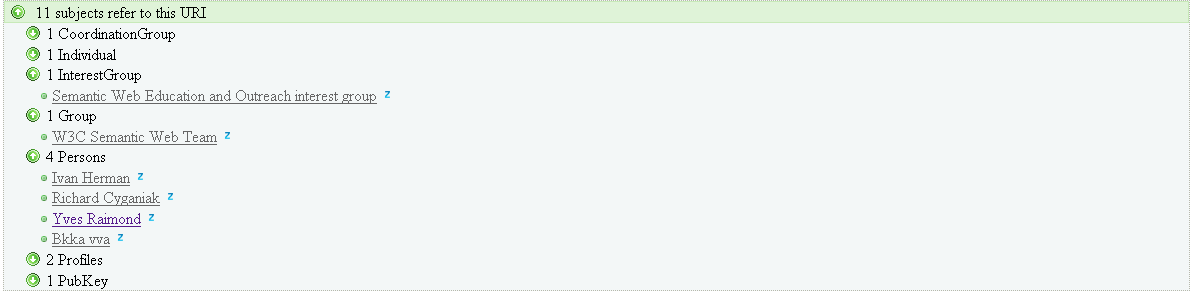
In the Figure 9 we expand the references of the Ivan Herman entity. We now see the entities, known by the Zitgist DataViewer, that refer to the Ivan Herman entity. One reference we see is to Yves Raimond:
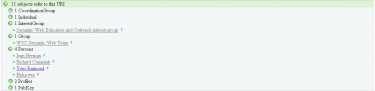
Figure9
Information Sources
On the semantic Web, everybody can describe anything about everything. This means that I can describe things about a person entity, or an album entity, or about virtually anything.
The only thing I have to do is to publish that information on the Web so that people can access it and do whatever they want with the information once published.
The information sources section of the Zitgist DataViewer is used to tell users where the information they are looking at comes from on the Web. So this section displays a link to all the Web pages where we got information about an entity that we display in the DataViewer.
This way, users can check the provenance (so accuracy and trust) of the information they are viewing.

Figure 10
Paging Tool
In some cases, there may be more than one resource to display to the user for a given data source. If there are more than five resources to display, results are paged. This is another feature to help the user to manage the overflow of information.
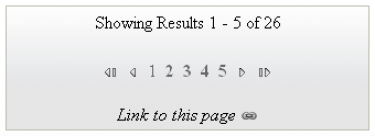
Figure 11
Since the pages are created asynchronously (using AJAX techniques), people also copy the link from their Web browser to send to others. To do so, the user simply clicks on the “link to this page” icon and then copies the URL.
Sidebar Tools
Another feature to manage information overload is the addition of sidebar tools:
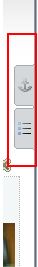
Figure 12
The user can click on the first tab to display the “Navigator Sidebar Tool” or on the second tab to display the “Selector Sidebar Tool”. Then he can re-click on these tabs to close and hide the sidebar.
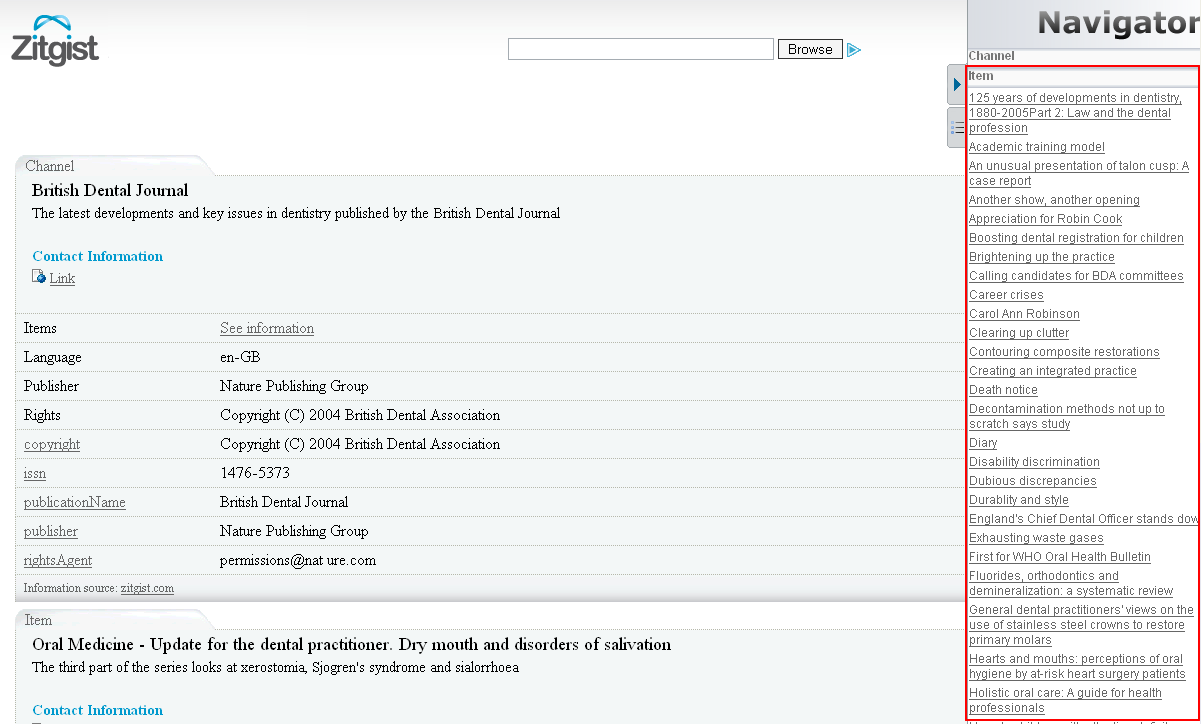
Navigator Sidebar Tool
This tool (Figure 13) provides an overview of the entities available for a given data source. All entities are aggregated in the same section of the tool depending on their type (all persons together, all documents together, etc.). By clicking on one of these items the user is redirected to the table displaying information about the entity.
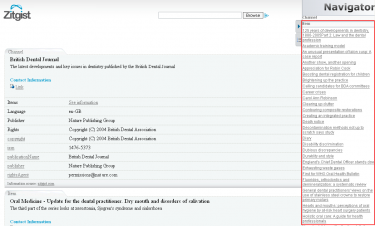
Figure 13
Selector Sidebar Tool
The Selector Sidebar Tool (Figure 14) is used to show and hide entities and properties to the user. By using this tool a user can hide things he doesn’t want to see:
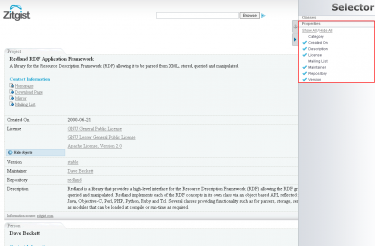
Figure 14
This tool can be really useful with some scenarios. For example, if a user only wants specific information from a given data source; then he only has to click on the “Hide all” button to hide all properties and then to click on the property he wants to see. This way, only the desired information will be displayed. In essence, the Selector works as a filtering or faceting mechanism.
The Templating System
The Zitgist DataViewer uses a templating system to organize the data available for a given entity. Depending on the type of an entity (is it a person? a music album? a document? a geographical place? etc.) the viewer will manage and organize the information available for an entity differently.
Each template tries to organize the information such that it is optimized for human reading and understanding.
By example, each template defines which information to put in the General Information section of each entity. It determines how to format and organize that information, how to handle specific things such as images, how to insert certain widgets such as maps and grids, and how to optimize the presentation of other kinds of information.
The only goal of the templates is to make information for each viewed entity more readable, so understandable, by humans.
The DataViewer’s new templating system also manages some properties even if a template is not defined, resulting in a hierarchy of templates composed of sub-templates inherited from upper templates.
This means that even if the Zitgist DataViewer doesn’t know how to organize information of a certain type of entity (because the viewer may not have a template for that type), it can organize other parts of the information based on existing templates and the behaviors of certain special properties.
Currently Supported Templates
There is the list of templates currently supported by the Zitgist DataViewer:
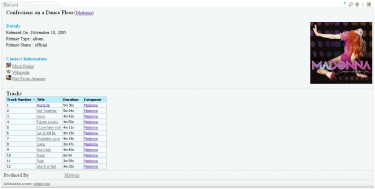
- Music Ontology templates:
- mo:Release
- mo:SoloMusicArtist
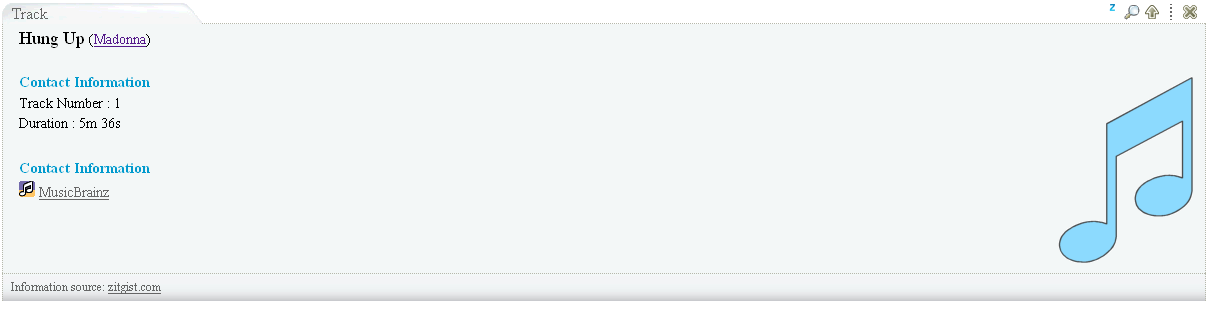
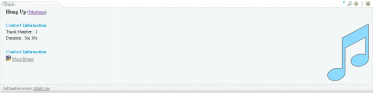
- mo:Track
- mo:MusicManifestation
- mo:MusicArtist
- mo:MusicGroup
Screenshots:
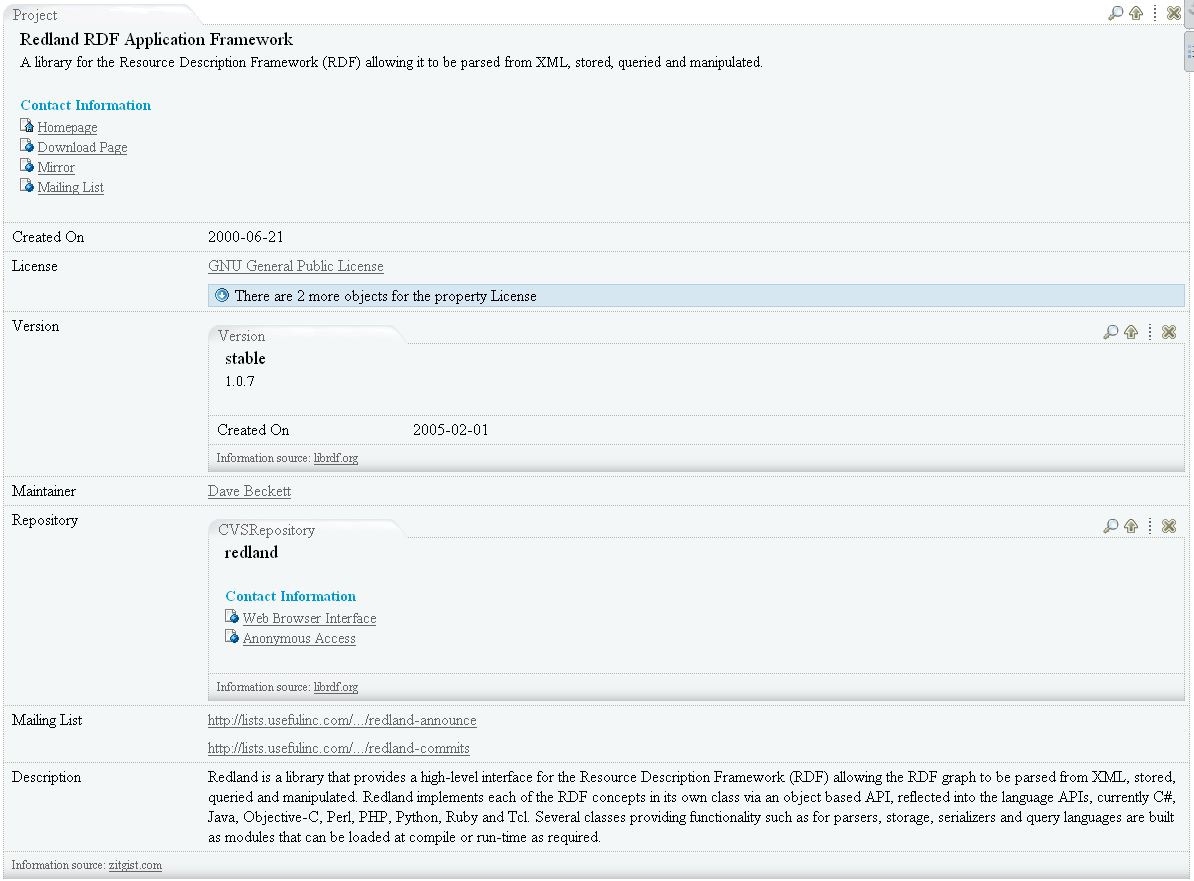
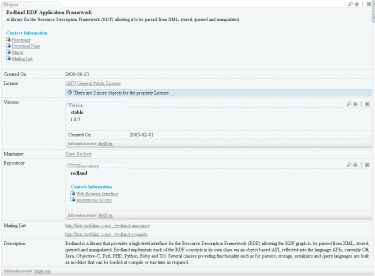
- Description Of A Project Ontology templates:
- doap:Project
- doap:Repository
- doap:Version
Screenshot:
- Friend Of A Friend Ontology templates:
- foaf:Agent
- foaf:Document
- foaf:Group
- foaf:Image
- foaf:OnlineAccount
- foaf:Person
Screenshot:
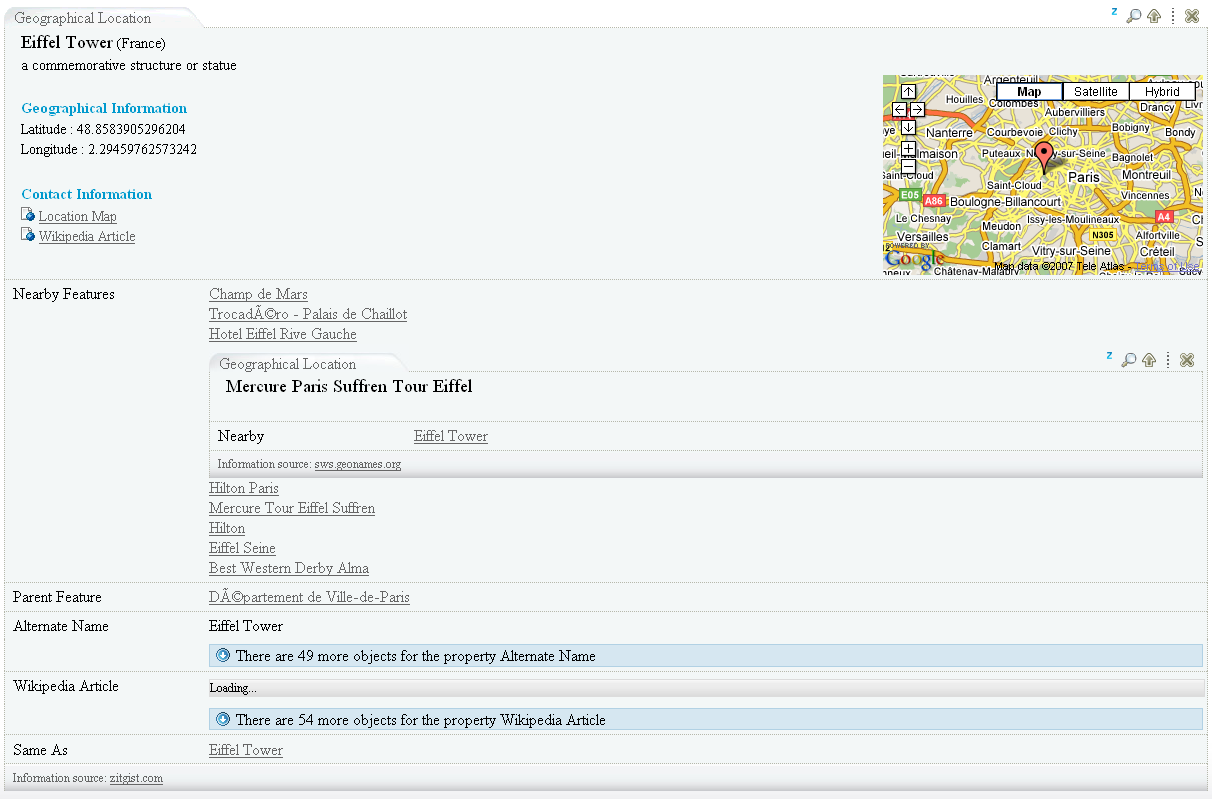
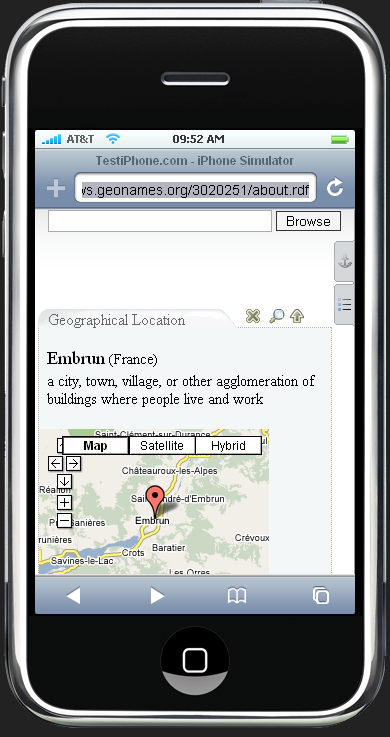
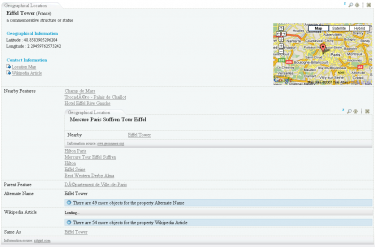
- Geonames Ontology templates:
Screenshot:
- Semantically-Interlinked Online Communities Ontology templates:
- sioc:User
- sioc:Container
- sioc:Forum
- sioc:Item
- sioc:Post
- sioc:Site
- sioc:Space
- sioc:Usergroup
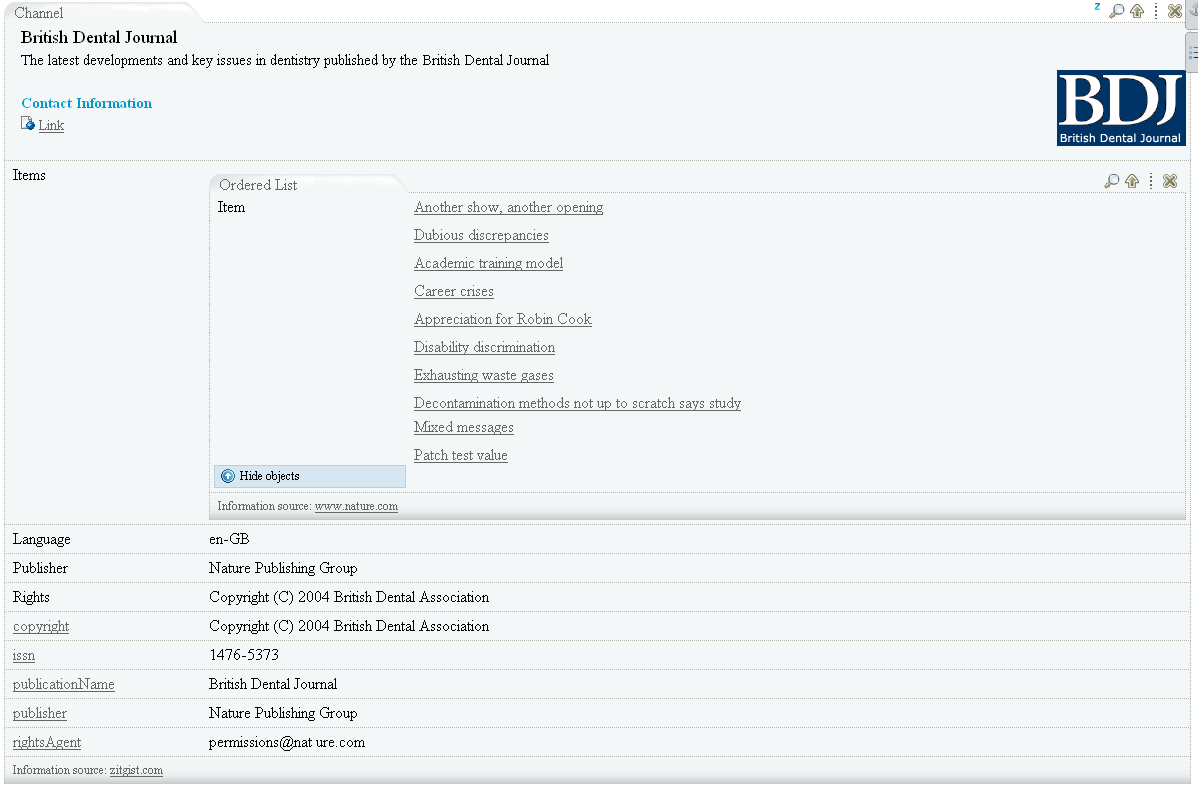
Other Ontologies also result in the addition of still more templates, for example: wgs84:Point, wps84:SpatialThing, bibo:Document, rss:Channel, rss:Image, rss:Item, frbr:Endeavour, frbr:Manifestation, rdf:Bag, rdf:Seq, owl:Thing.
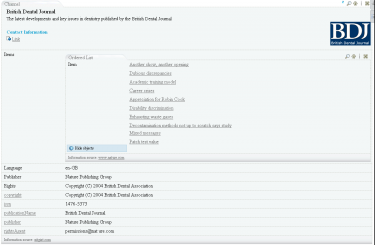
One more screenshot (RSS):
The Skinning System
While the templates organize the structure and scope of information about entities, skins manage the appearance of that organized information. The Skinning System for the DataViewer governs which colors to use, which images to use, which dimensions to use, where to place on the screen, and what to show.
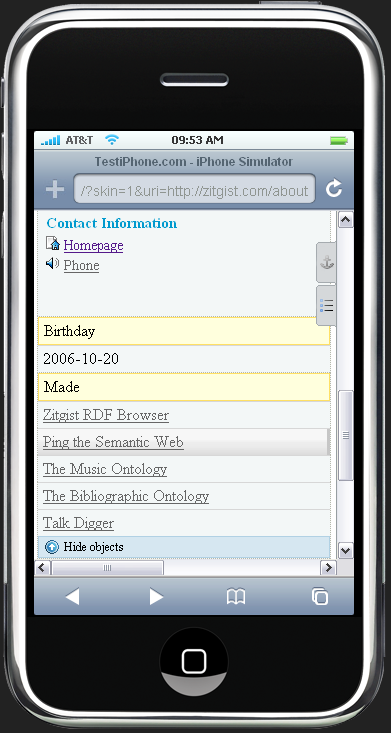
There are currently two skins created for the Zitgist DataViewer. The default skin is the standard appearance of the DataViewer within your Web browser. The second skin – called the mini-Dataviewer – is used to optimize the display of the DataViewer within a restricted area, such as a small container on a Web page or a mobile device such as the iPhone.
Figures 15 and 16 show two entities viewed with this mini-DataViewer interface on an iPhone. As you can see, the information is not displayed the same way, and the user interface and colors have changed to optimize for a small mobile device.

Figure 15

Figure 6
zLinks within the DataViewer
From earlier posts, recall:
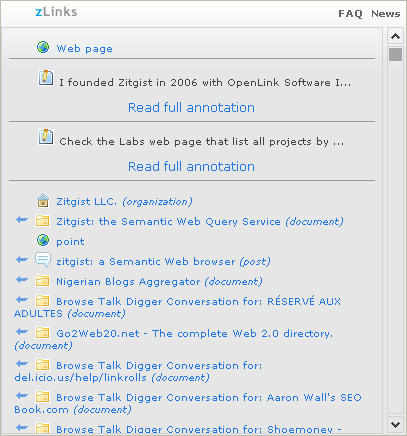
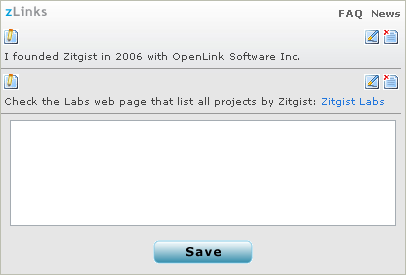
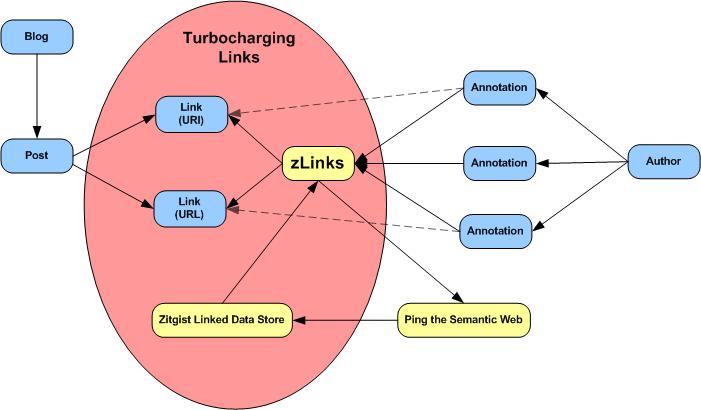
“The zLinks client-side service is an entry point to a vast new world of additional rich data and link-related services […] zLinks automatically ‘turbocharges’ all of your existing and new content links to tap these resources that are contextual, relevant, informative and actionable.”
The zLinks Web service has now been integrated within the Zitgist DataViewer.
Users now have access to related stuff about every linked entity displayed in the DataViewer. These zLinks provide not only related information about an entity, but also what that entity is about and what also refers to it.
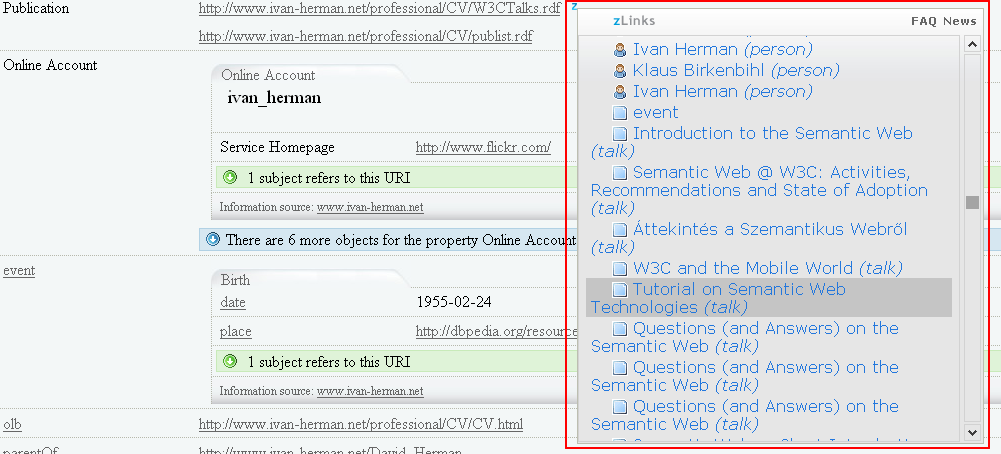
In the Figure 17 we use the zLinks Web service to take a look at the publications (in this example, the talks) linked from the entity Ivan Herman. The service lists all talks by Ivan, as well as provides links to his personal profiles and to the profiles of his friends.
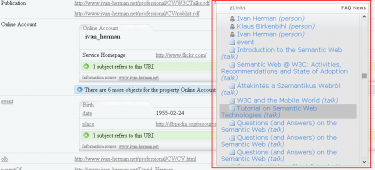
Figure 17
Dataviewing examples
There are a couple of visualization of URIs using the Zitgist DataViewer.
The default DataViewer user interface:
The mini-DataViewer user interface (you will be redirected to an iPhone testing website):
Conclusion
The Zitgist DataViewer is the next step to make semantic Web data more accessible and usable. It is an important upgrade over its earlier version, what had been known as the Zitgist Browser.
We are now learning how to move beyond the “triple” and how to better visualize semantic Web (RDF) information published on the Web. Many new features in the DataViewer help users to manage information overload. Others provide feedback or access to still further useful information. Performance and display speeds have been improved. Organization and a templating system add further flexibility.
We believe the usability of the DataViewer has been greatly enhanced. Still, we are not satisfied. We welcome your feedback and will continue to seek improvements for the next round of enhancements. Zitgist is committed to data usability and ease of access. We welcome your participation as we continue on this quest!
 Eight months ago we announced the dissolution of Zitgist LLC. This event led to the creation of a “sandbox“ to keep alive all the online assets of the company. Since this sandbox server was not owned by Structured Dynamics, it was becoming hard for us to update UMBEL and its online services. It is why we took the time to move the services back on to our new servers.
 Additionally, the Ping the Semantic Web RDF pinging service is now the property of OpenLink Software Inc. OpenLink is now hosting, maintaining and developing the service.