The Winnipeg City’s NOW (Neighbourhoods Of Winnipeg) Portal is an initiative to create a complete neighbourhood web portal for its citizens. At the core of the project we have a set of about 47 fully linked, integrated and structured datasets of things of interests to Winnipegers. The focal point of the portal is Winnipeg’s 236 neighbourhoods, which define the main structure of the portal. The portal has six main sections: topics of interests, maps, history, census, images and economic development. The portal is meant to be used by citizens to find things of interest in their neibourhood, to learn their history, to see the images of the things of interest, to find tools to help economic development, etc.
The NOW portal is not new; Structured Dynamics was also its main technical contractor for its first release in 2013. However we just finished to help Winnipeg City’s NOW team to migrate their older NOW portal from OSF 1.x to OSF 3.x and from Drupal 6 to Drupal 7; we also trained them on the new system. Major improvements accompany this upgrade, but the user interface design is essentially the same.
The first thing I will do is to introduce each major section of the portal and I will explain the main features of each. Then I will discuss the new improvements of the portal.
[extoc]
Datasets
A NOW portal user won’t notice any of this, but the main feature of the portal is the data it uses. The portal manages 47 datasets (and growing) of fully structured, integrated and linked datasets of things of interests to Winnipegers. What the portal does is to manage entities. Each kind of entity (swimming pools, parks, places, images, addresses, streets, etc.) are defined with multiple properties and values. Several of the entities reference other entities in other datasets (for example, an assessment parcel from the Assessment Parcels dataset references neighbourhoods entities and property addresses entities from their respective datasets).
The fact that these datasets are fully structured and integrated means that we can leverage these characteristics to create a powerful search experience by enabling filtering of the information on any of the properties, to bias the searches depending where a keyword search match occurs, etc.
Here is the list of all the 47 datasets that currently exists in the portal:
- Aboriginal Service Providers
- Arenas
- Neighbourhoods of Winnipeg City
- Streets
- Economic Development Images
- Recreation & Leisure Images
- Neighbourhoods Images
- Volunteer Images
- Library Images
- Parks Images
- Census 2006
- Census 2001
- Winnipeg Internal Websites
- Winnipeg External Websites
- Heritage Buildings and Resources
- NOW Local Content Dataset
- Outdoor Swimming Pools
- Zoning Parcels
- School Divisions
- Property Addresses
- Wading Pools
- Electoral wards of Winnipeg City
- Assessment Parcels
- Libraries
- Community Centres
- Police Service Centers
- Community Gardens
- Leisure Centres
- Parks and Open Spaces
- Community Committee
- Commercial real estates
- Sports and Recreation Facilities
- Community Characterization Areas
- Indoor Swimming Pools
- Neighbourhood Clusters
- Fire and Paramedic Stations
- Bus Stops
- Fire and Paramedic Service Images
- Animal Services Images
- Skateboard Parks
- Daycare Nurseries
- Indoor Soccer Fields
- Schools
- Truck Routes
- Fire Stations
- Paramedic Stations
- Spray Parks Pads
Structured Search
The most useful feature of the portal to me is its full-text search engine. It is simple, clean and quite effective. The search engine is configured to try to give the most relevant results a NOW portal user may be searching. For example, it will positively bias some results that comes from some specific datasets, or matches that occurs in specific property values. The goal of this biasing is to improve the quality of the returned results. This is somewhat easy to do since the context of the portal is well known and we can easily boost scoring of search results since everything is fully structured.
Another major gain is that all the search results are fully templated. The search results do not simply return a title and some description for your search results. It does template all the information the system has about the matched results, but also displays the most relevant information to the users in the search results.
For example, if I search for a indoor swimming pool, in most of the cases it may be to call the front desk to get some information about the pool. This is why different key information will be displayed directly in the search results. That way, most of the users won’t even have to click on the result to get the information they were looking for directly in the search results page.
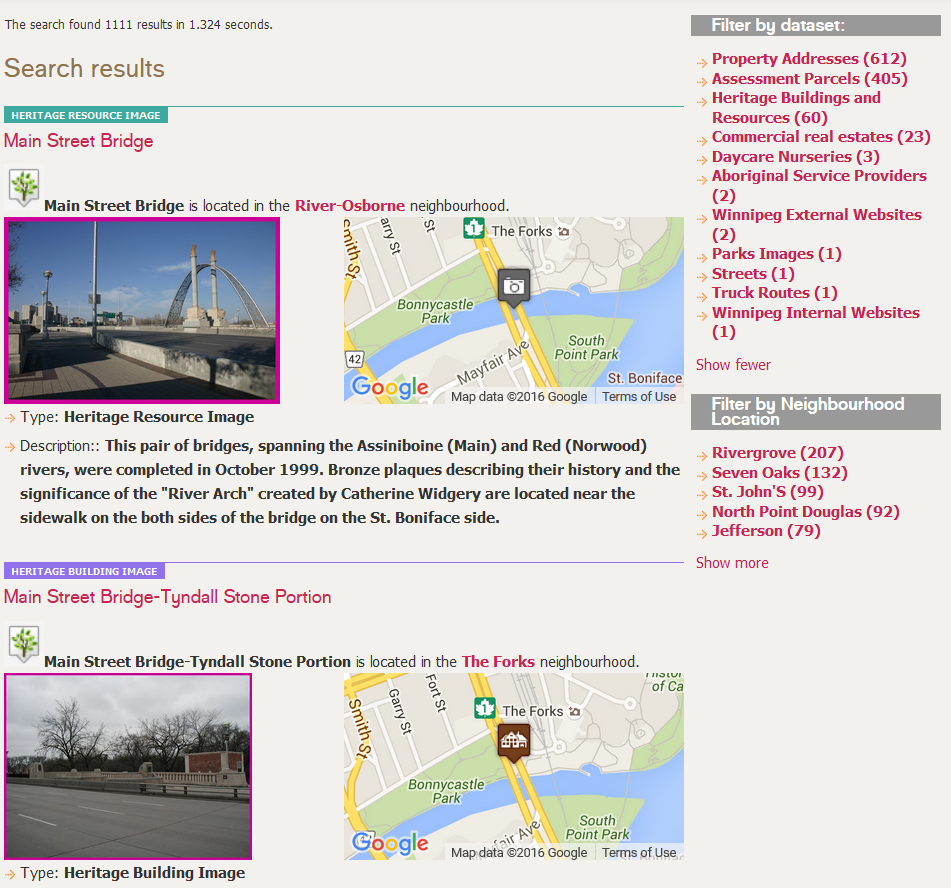
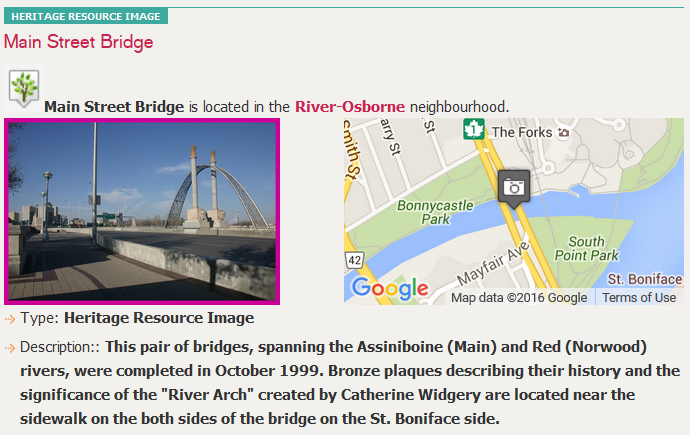
Here is an example of a search for the keywords main street. As you can notice, you are getting different kind of results. Each result is templated to get the core information about these entities. You have the possibility to focus on particular kind of entities, or to filter by their location in specific neighbourhoods.
Templated Search Results
Now let’s see some of the kind of entities that can be searched on the portal and how they are presented to the users.
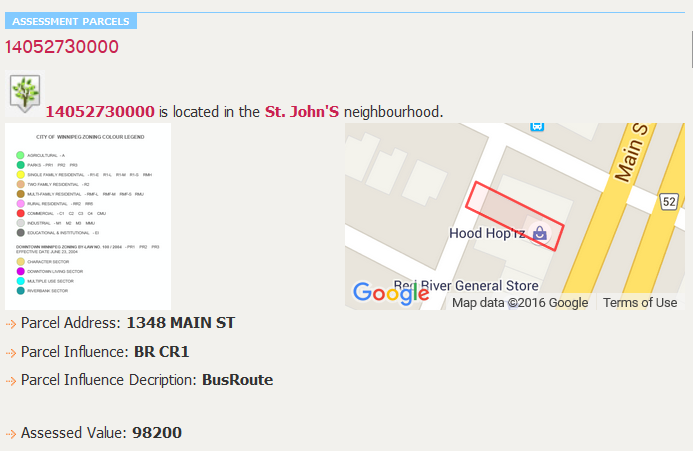
Here is an example of an assessment parcel that is located in the St. John’s neighbourhood. The address, the value, the type and the location of the parcel on a map is displayed directly into the search results.
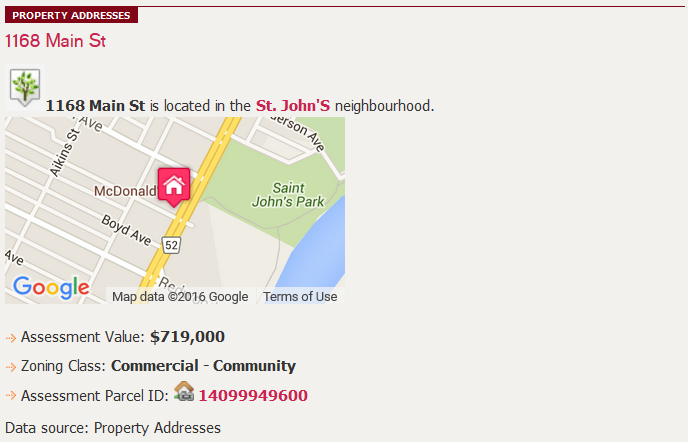
Another kind of entity that can be searched are the property addresses. These are located on a map, the value of the parcels and the building and the zoning of the address is displayed. The property is also linked to its assessment parcel entity which can be clicked to get additional information about the parcel.
Another interesting type of entity that can be searched are the streets. What is interesting in this case is that you get the complete outline of the street directly on a map. That way you know where it starts and where it ends and where it is located in the city.

There are more than a thousand geo-localized images of all different things in the city that can be searched. A thumbnail of the image and the location of the thing that appears on the image appears in the search results.
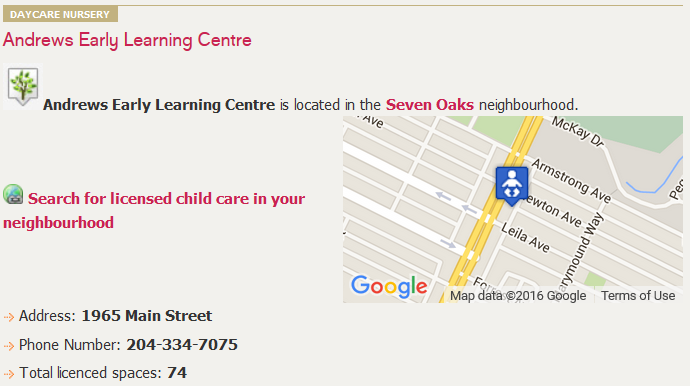
If you were searching for a nursery for your new born child, then you can quickly see the name, location on a map and the phone number of the nursery directly in the search result.
There are just a few examples of the fifty different kind of entities that can appear like this in the search results.
Mapping
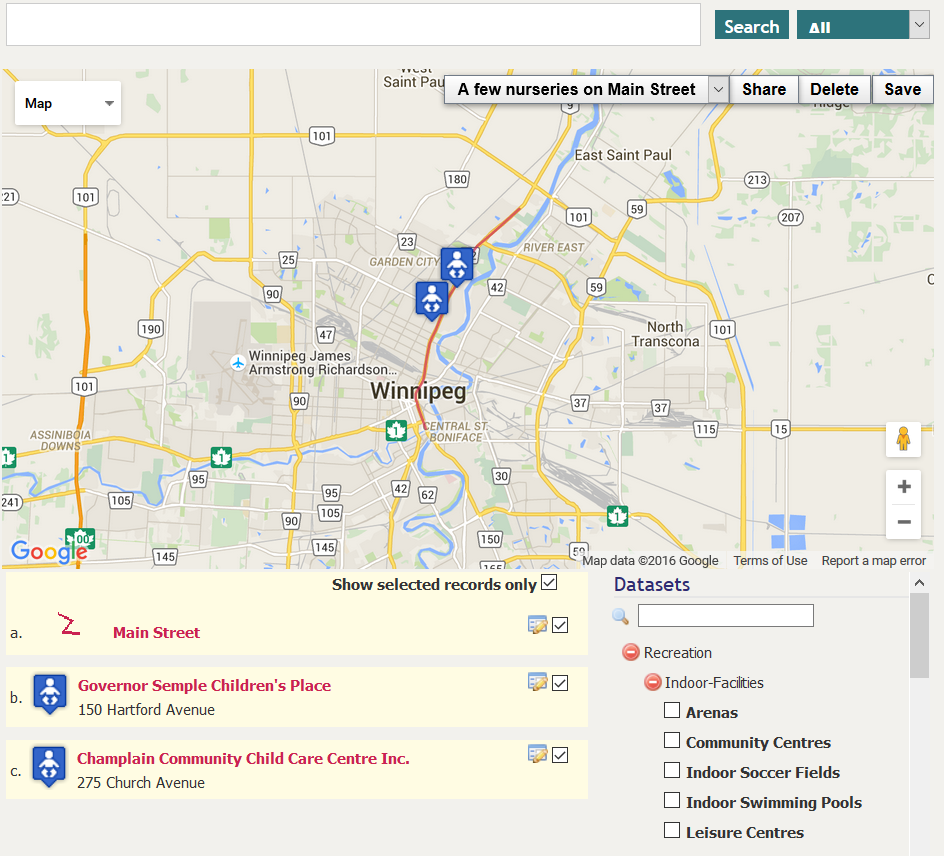
The mapping tool is another powerful feature of the portal. You can search like if you were using the full-text search engine (the top search box on the portal) however you will only get the results that can be geo-localized on a map. You can also simply browse entities from a dataset or you can filter entities by their properties/values. You can persist entities you find on the map and save the map for future reference.
In the example below, it shows that someone searched for a street (main street) and then he persisted it on the map. Then he search for other things like nurseries and selected the ones that are near the street he persisted, etc. That way he can visualize the different known entities in the portal on a map to better understand where things are located in the city, what exists near a certain location, within a neighbourhood, etc.
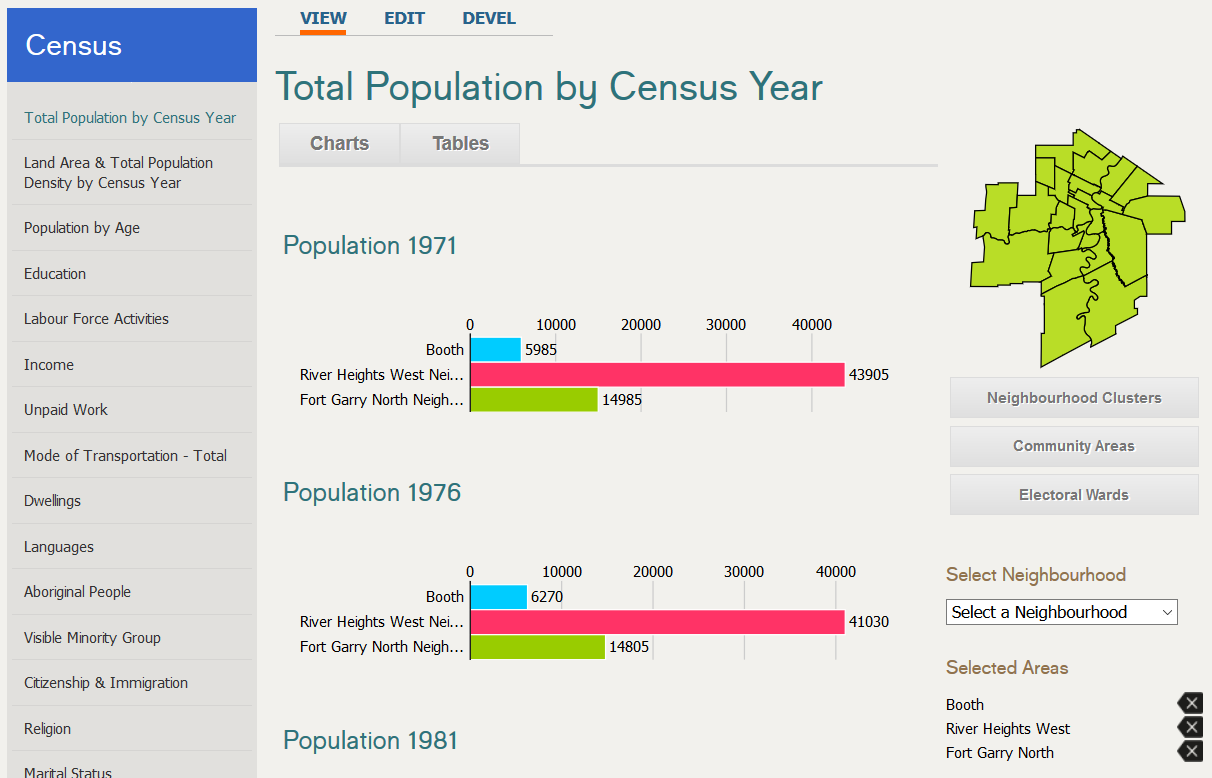
Census Analysis
Census information is vital to the good development of a city. They are necessary to understand the trends of a sector, who populates it, etc., such that the city and other organizations may properly plan their projects to have has much impact as possible.
These are some of the reason why one of the main section of the site is dedicated to census data. Key census indicators have been configured in the portal. Then users can select different kind of regions (neighbourhood clusters, community areas and electoral wards) to get the numbers for each of these indicators. Then they can select multiple of these regions to compare each other. A chart view and a table view is available for presenting the census data.
History, Images & Points of Interest
The City took the time to write the history of each of its neighbourhoods. In additional to that, they hired professional photographs to photograph the points of interests of the city, to geo-localize them and to write a description for each of these photos. Because of this dedication, users of the portal can learn a much about the city in general and the neighbourhood they live in. This is what the History and Image sections of the website are about.
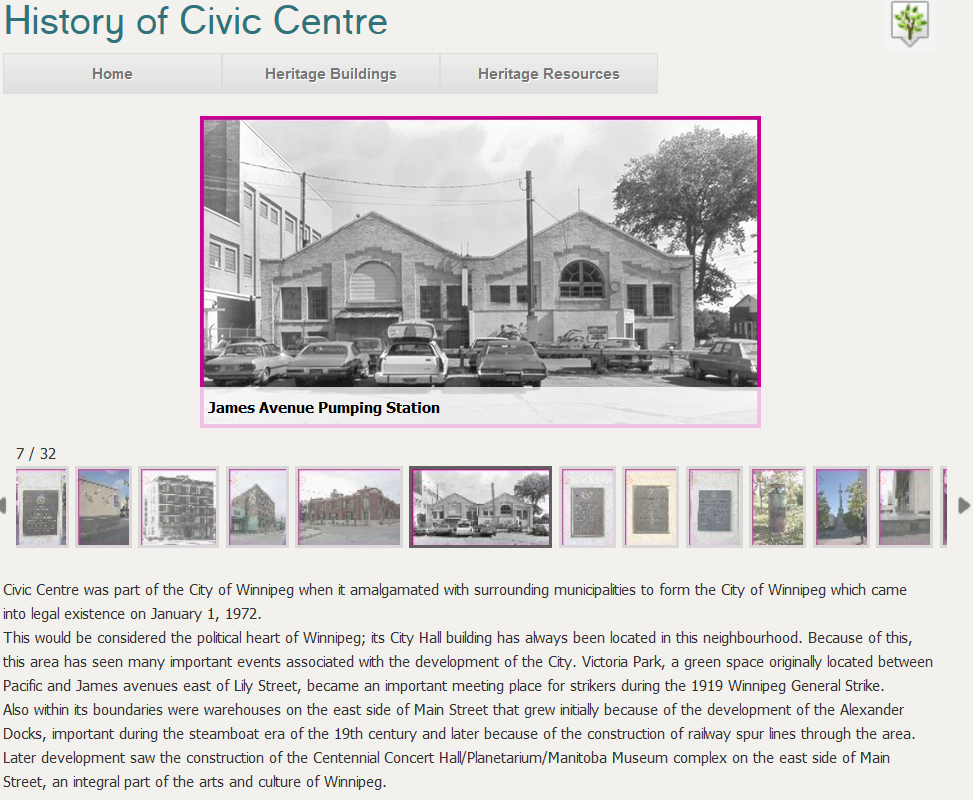
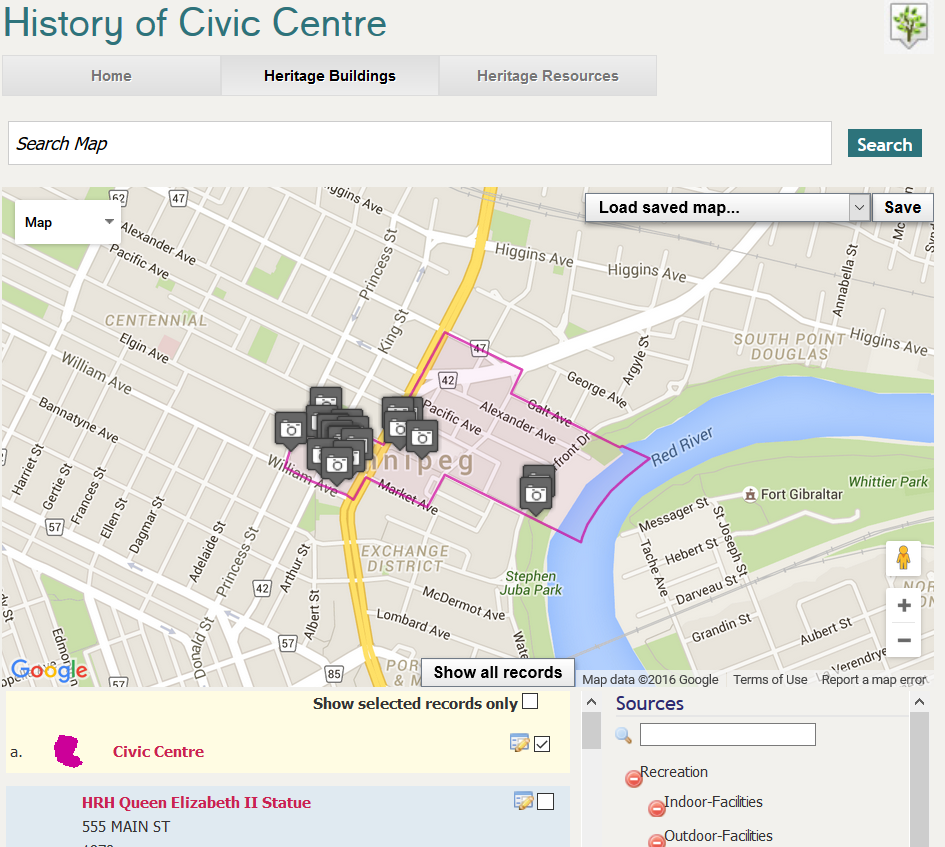
Historic buildings are displayed on a map and they can be browsed from there.
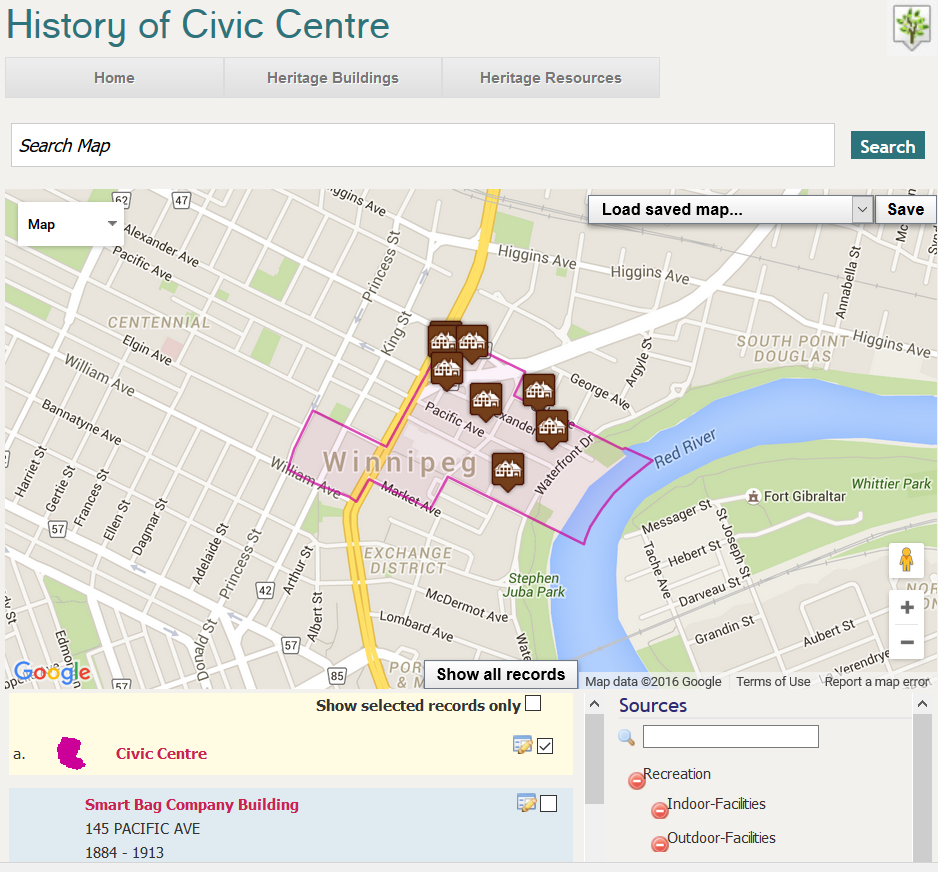
Images of points of interests in the neighbourhood are also located on a map.
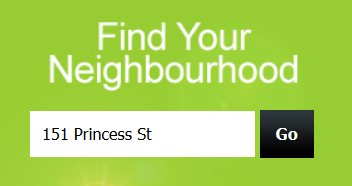
Find Your Neighbourhood
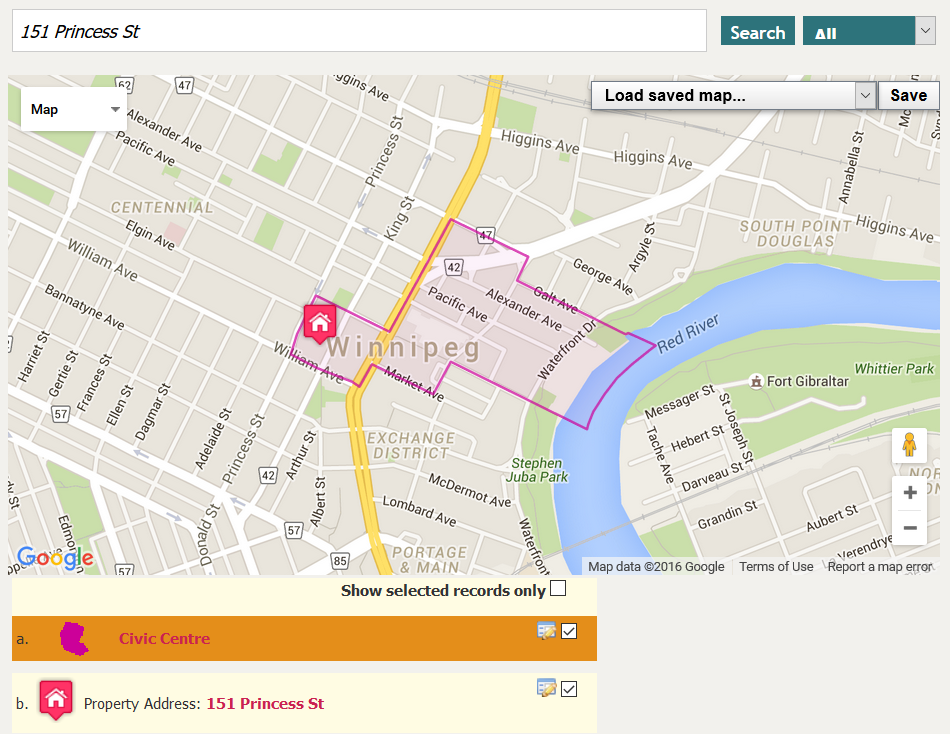
Ever wondered in which neighbourhood you live in? No problem, go on the home page, put your address in the Find your Neighbourhood section and you will know it right away. From there you can learn more about your neighbourhood like its history, the points of interest, etc.
Your address will be located on a map, and your neighbourhood will be outlined around it. Not only you will know in which neighbourhood you live, but you will also know where you live within it. From there you can click on the name of the neigbourhood to get to the neighbourhood’s page and start learning more about it like its history, to see photos of points of interest that exists in your neighbourhood, etc.
Browsing Content by Topic
Because all the content of the portal is fully structured, it is easy to browse its content using a well defined topic structure. The city developed its own ontology that is used to help the users browse the content of the portal by browsing topics of interest. In the example below, I clicked the Economic Development node and then the Land use topic. Finally I clicked the Map button to display things that are related to land use: in this case, zoning and assessment parcels are displayed to the user.
This is another way to find meaningful and interesting content from the portal.
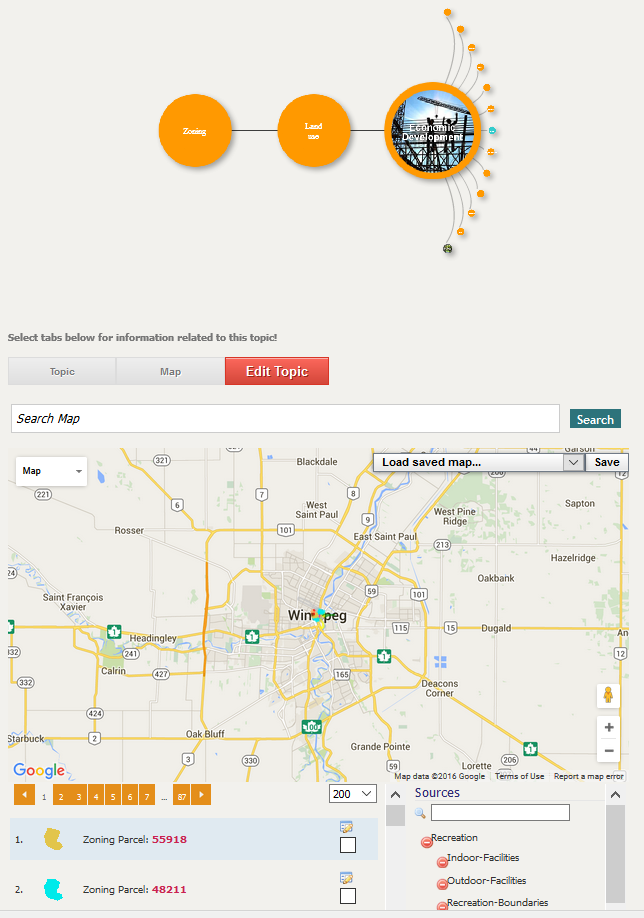
Depending on the topic you choose, and the kind of information related to that topic, you may end up with different options like a map, a list of links to documents related to that topic, etc.
Export Content
Now that I made an overview of each of the main features of the portal, let’s go back to the geeky things. The first thing I said about this portal is that at its core, all information it manages is fully structured, integrated and linked data. If you get to the page of an entity, you have the possibility to see the underlying data that exists about it in the system. You simply have to click the Export tab at the top of the entity’s page. Then you will have access to the description of that entity in multiple different formats.

In the future, the City should (or at least I hope will) make the whole set of datasets fully downloadable. Right now you only have access to that information via that export feature per entity. I hope because this NOW portal is fully disconnected from another initiative by the city: data.winnipeg.ca, which uses Socrata. The problem is that barely any of the datasets from NOW are available on data.winnipeg.ca, and the ones that are appearing are the raw ones (semi-structured, un-documented, un-integrated and non-linked) all the normalization work, the integration work, the linkage work done by the NOW team hasn’t been leveraged to really improve the data.winnipeg.ca datasets catalog.
New with the upgrades
Those who are familiar with the NOW portal will notice a few changes. The user interface did not change that much, but multiple little things got improved in the process. I will cover the most notable of these changes.
The major changes that happened are in the backend of the portal. The data management in OSF for Drupal 7 is incompatible with what was available in Drupal 6. The management of the entities became easier, the configuration of OSF networks became a breeze. A revisioning system has been added, the user interface is more intuitive, etc. There is no comparison possible. However, portal users’ won’t notice any of this, since these are all site administrator functions.
The first thing that users will notice is the completely new full-text search engine. The underlying search engine is almost the same, but the presentation is far better. All entity types have gotten their own special template, which are displayed in a special way in the search results. Most of the time results should be much more relevant, filtering is easier and cleaner. The search experience is much better in my view.
The overall site performance is much better since different caching strategies have been put in place in OSF 3.x and OSF for Drupal. This means that most of the features of the portal should react more swiftly.
Now every type of entity managed by the portal is templated: their webpage is templated in specific ways to optimize the information they want to convey to users along with their search result “mini page” when they get returned as the result of a search query.
Multi-linguality is now fully supported by the portal, however not everything is currently templated. However expect a fully translated NOW portal in French in the future.
Creating a Network of Portals
One of the most interesting features that goes with this upgrade is that the NOW portal is now in a position to participate into a network of OSF instances. What does that mean? Well, it means that the NOW portal could create partnerships with other local (regional, national or international) organizations to share datasets (and their maintenance costs).
Are there other organizations that uses this kind of system? Well, there is at least another one right in Winnipeg City: MyPeg.ca, also developed by Structured Dynamics. MyPeg uses RDF to model its information and uses OSF to manage its information. MyPeg is a non-profit organization that uses census (and other indicator) data to do studies on the well being of Winnipegers. The team behind MyPeg.ca are research experts in indicator data. Their indicator datasets (which includes census data) is top notch.
Let’s hypothetize that there would be interest between the two groups to start collaborating. Let’s say that the NOW portal would like to use MyPeg’s census datasets instead of its own since they are more complete, accurate and include a larger number of important indicators. What they basically want is to outsource the creation and maintenance of the census/indicators data to a local, dedicated and highly professional organization. The only things they would need to do is to:
- Formalize their relationship by signing a usage agreement
- The NOW portal would need to configure the MyPeg.ca OSF network into their OSF for Drupal instance
- The NOW portal would need to register the datasets it want to use from MyPeg.ca.
Once these 3 steps are done, taking no more than a couple of minutes, then the system administrators of the NOW portal could start using the MyPeg.ca indicator datasets like they were existing on their own network. (The reverse could also be true for MyPeg.) Everything would be transparent to them. From then on, all the fixes and updates performed by MyPeg.ca to their indicator datasets would immediately appear on the NOW portal and accessible to its users.
This is one possibility to collaborate. Another possibility would be to simply on a routine basis (every month, every 6 months, every year) share the serialized datasets such that the NOW portal re-import the dataset from the files shared by MyPeg.ca. This is also possible since both organizations use the same Ontology to describe the indicator data. This means that no modification is required by the City to take that new information into account, they only have to import and update their local datasets. This is the beauty of ontologies.
Conclusion
The new NOW portal is a great service for citizens of Winnipeg City. It is also a really good example of a web portal that leverages fully structured, integrated and linked data. To me, the NOW portal is a really good example of the features that should go along with a municipal data portal.